Curves Graph
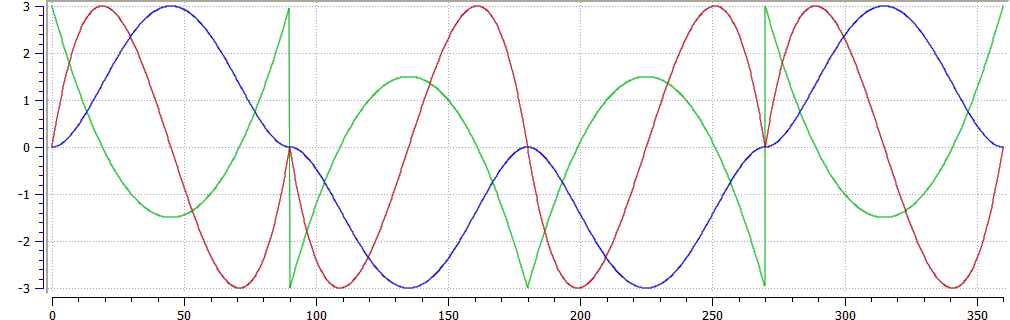
![]() In physics, jerk is the rate of change of acceleration; more precisely, the derivative of acceleration with respect to time (the third derivative) curves are displayed in the lower graph. All plots are displayed by default.
In physics, jerk is the rate of change of acceleration; more precisely, the derivative of acceleration with respect to time (the third derivative) curves are displayed in the lower graph. All plots are displayed by default.
With the check boxes in the Curve selection table shown in Curve Selection Table, you can select or clear each individual curve that you want to be displayed.
The Y-scale of the Curves graph is adjusted to display the Y-scale of the selected curve in the Curve Selection Table. The color of the Y-axis scale "tick" lines is also changed to match the color code of the selected curve.
|
Y axis |
Unit |
Description |
|
Vel |
Units/Time |
Being the rate of change of position, the velocity is the ratio between the slave and master derivatives |
|
Accel |
Units/Time2 |
Rate of change of velocity with time |
|
Units/Time3 |
Rate of change of acceleration; more precisely, the derivative of acceleration with respect to time |
In general the numbers relate to how the Y-axis positions (Cam Output) change with respect to the X-axis positions (CAMinput).
The zoom and pan functions, when performed on the cam profile graph, are duplicated in the Curves graph.
Zoom and pan functions are not available when the cursor is in the curves graph.


